Reporting
Concepts
The Self-Service Monitoring Portal lets you easily build queries and reports.
|
Queries |
- Include a single query against the SelfServiceMonitoringPortal database - Can be a graph, a table, or a simple list of elements - Are available only through the ProactivePack console - Cannot be generated as PDF/XLS documents - Can belong to yourself (scope=private), your group (scope=group) or be globally available (scope=global) |
|
Reports |
- Include one or more SelfServiceMonitoringPortal queries - Can be run within the console - Can be generated under the form of html, xls, or pdf documents - Can belong to yourself (scope=private), your group (scope=group) or be globally available (scope=global) |
Using Self-Service Monitoring Portal reporting
The single-entry point to manage Self-Service Monitoring Portal reports and queries is the “Configuration Reports” tile in the ProactivePack Self-Service Monitoring Portal menu.
Accessing this use case requires to have the UseCaseSMPReporting permission. More permissions can be used to restrict further the access to the reports, see User restrictions and Security.
Creating queries
1. Within the Reporting page, press the “Create a new query” button
2. In the editor page, you may:
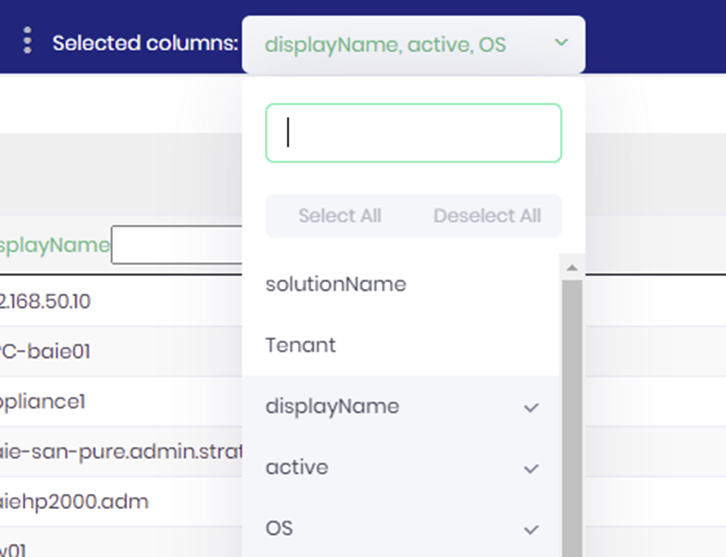
a. Select one or more attributes that you want to display. The number of attributes you can select depends on the graph type. For a “pie chart”, only one dimension is allowed, while for a table, multiple dimensions can be selected.
b. Build filtering conditions using the dialog shown using the button . The editor usage is straightforward.
c. Include sections (instances) – One section is created for each value of the selected “order by” dimension.
d. Change the graph type on the fly. Use the buttons below to switch from one graph type to another.
Legend to the toolbar:
|
|
Create instanciation (one graph per value of the dimension provided in the “order by” dropdown |
|
|
Toggles on/off the display of the filter editor |
|
|
Simple bar - Displays the number of occurrences of a single dimension - |
|
|
Composite bar - Displays the number of a first dimension, one bar per value of a given slot, grouping by another dimension |
|
|
Pie - Displays the distribution of a single dimension |
|
|
Donut - Displays the distribution of a single dimension |
|
|
Table view |
|
|
Simple list (one-column table) |
|
|
Shows results as tiles |
|
|
Shows results in a network map |
|
|
Shows results as widgets |
|
|
Export current content as and excel file |
|
|
Export current content as a csv file |


3. Once the query is ready, save it using the “save query” button at the bottom of the page.
|
Query Name |
Mandatory. A short name for the request you save (special characters are not allowed as the short name is used to build a file name). |
|
Description |
Optional. A free text description for the request |
|
Scope |
Determines the scope (visibility) of the query. The choices that are available depend on the user permissions. - Private: only the user who creates the query will be able to use it. - Group: Only members of the user’s group will be able to use this query. - Global: All users will be able to use this query. |
Creating reports
1. Within the Reporting page, press the “Create a report” button.
2. In the next page, you can manage one or more sections that will make up the report.
a. Add and delete sections using the  buttons
b. Change page format (landscap or portait) using  icon
icon
c. Rename any section by double-clicking on the section name or using the  button
d. The section content can be :
i. An existing, already saved query (see above)
ii. An unqualified query
3. Once the report is ready, save it using the “save report” button at the bottom of the page.
|
Report Name |
Mandatory. A short name for the report you save (special characters and spaces are not allowed as the short name is used to build a file name). |
|
Description |
Optional. A free text description for the report |
|
Scope |
Determines the scope (visibility) of the report. The choices that are available depend on the user permissions. - Private: only the user who creates the query will be able to use it. - Group: Only members of the user’s group will be able to use this query. - Global: All users will be able to use this query. |
“Right-Click” functionality
When using Reporting as a table, you can use Right Click to:
· Add filtering condition
· Jump to Configuration use cases
Both features depends on your selection.
Il you select:
Then you will be able to:
1) Improve current filetring conditions using “Right click” on a table line such as:
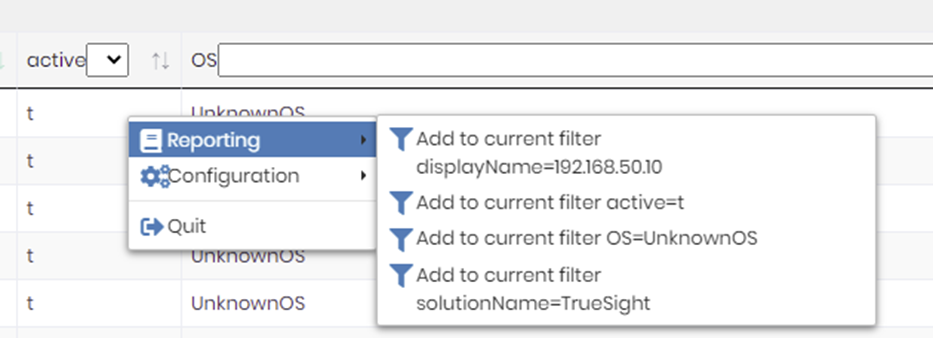
2) Jump to configuration use case for each selected dimension
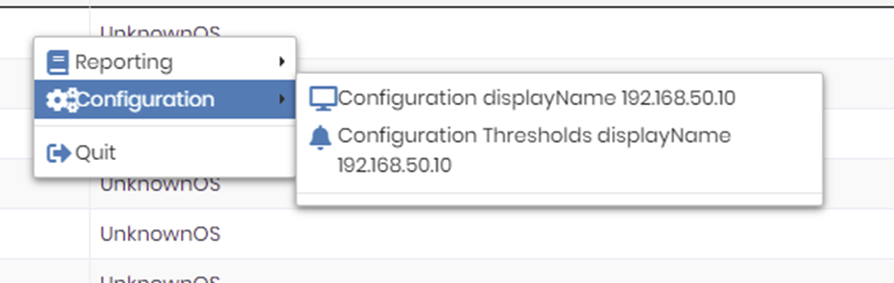
This will open configuration forms according to selected dimension.
Advanced topics
Custom dimensions
It is possible to add your own dimensions to the reporting database and use those in the Self-Service Monitoring Portal reports.
These dimensions are set at “device” level – that is, you can associate external information (customer name, location, cost center, etc) for each device discovered by ProactivePack.
In order to do that :
Declare the dimension in the configuration
1. If it is the first customization you apply to the xml file, copy it from $PRODUCT_HOME/config/SelfServiceMonitoringPortalDeviceTranslation.xml to $PRODUCT_HOME/config/custom/SelfServiceMonitoringPortalDeviceTranslation.xml
2. Open $PRODUCT_HOME/config/custom/SelfServiceMonitoringPortalDeviceTranslation.xml
3. Declare dimension in file
a. The xml tag must be unique and will be the displayed label in ProactivePack
b. SlotType must be STRING
c. DBTable must be “AdditionnalInfos”
d. DBColumn must be “InfoValue”
For example :
<CostCenter version="1.0" SlotType="STRING" DBTable="AdditionnalInfos" DBColumn="InfoValue"></CostCenter>
4. Save file
Declare the import mechanism
You must then declare how the DB will be populated with the information.
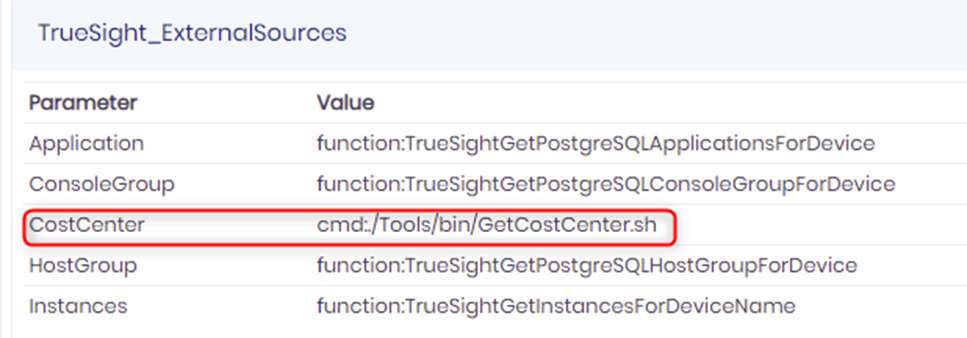
The most straightforward way is to declare an external source (see External Sources for details) that will output the desired value for each device.
For example, the script “GetCostCenter.sh” will output the cost center number for each “TrueSight” device. To use the script, declare it as an external source in the TrueSight_ExternalSources section of the SelfServiceMonitoringPortal configuration :
The following information are sent as positional arguments to the script:
|
Position |
Information |
Example |
|
1 |
Date (last update date of device in DB) |
2018-11-15 |
|
2 |
Time (last update date of device in DB) |
17:59:19 |
|
3 |
solutionName |
TrueSight |
|
4 |
solutionInstance |
TrueSight |
|
5 |
deviceId |
1384 |
|
6 |
devicePort |
3181 |
|
7 |
displayName |
vm-rh7-mysql |
|
8 |
DnsName |
vm-rh7-mysql.mydomain.com |
|
9 |
active |
t |
|
10 |
OS |
Linux |
|
11 |
ipAddress |
192.168.100.23 |
|
12 |
Tenant |
BmcRealm |
Then a script such as:
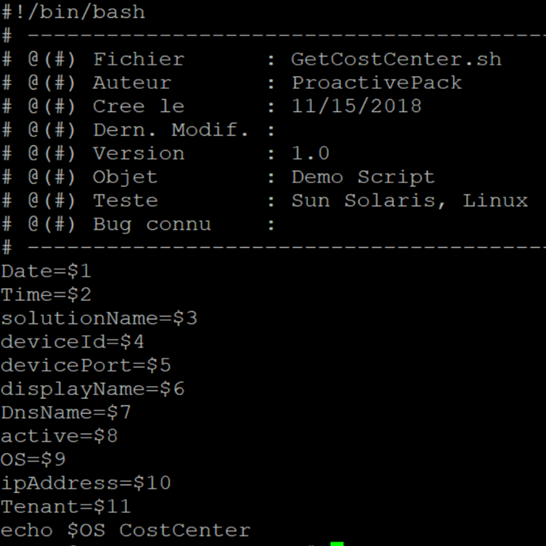
Script output will be imported to CostCenter information. Output can be coma (,) separated or on multiple lines.
Alternatively, check out the content of the AdditionalInfos datatable and inject your own data there.
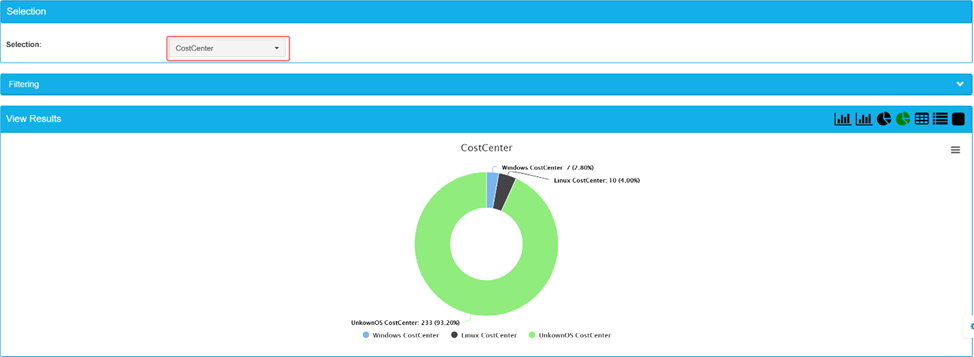
Will create Cost Center based on OS and transform:
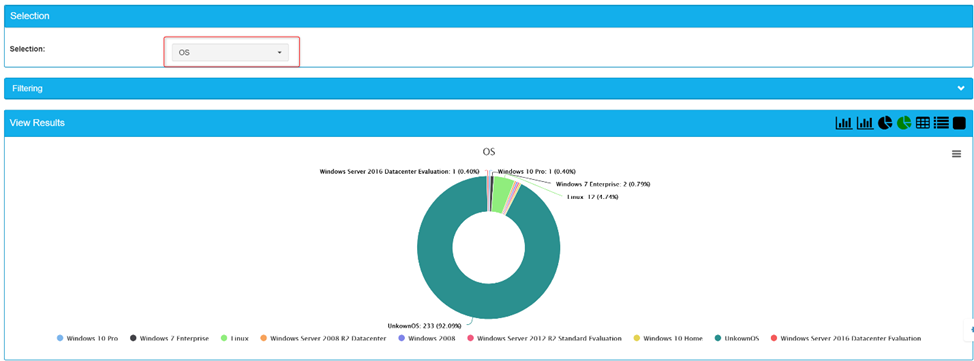
To
Instance Info
In some situations additional information related to a monitored instance is useful when delivering monitoring configuration reports. In the context of TrueSight, it is possible to extract additional information from the agent configuration variables. For example, in the context of logfile monitoring, you can extract information on the exact logfile that is monitored, the strings that are searched for, and so on.
A basic set of “additional infos” is provided with the product, they can be found in the file :
$PRODUCT_HOME/config/TrueSightInstanceInfoMapping.cfg
Customizations and additions can be added in a file with the same format under
$PRODUCT_HOME/config/custom/TrueSightInstanceInfoMapping.cfg
The file contains entries as follows:
[<Application class>]
RealInstanceName=/some/pconfig/var/%instance%/suffix
<AdditionalInfo>=/some/pconfig/var/%instance%/Info
<AdditionalInfo2>*=/some/pconfig/var/%instance%/anotherlevel/*/Info2
Where :
· RealInstanceName is an optional key to retrieve the actual logical name of the instance based on the value of the pconfig variable provided as /some/pconfig/var/%instance%/suffix
· <Application class> is the name of the application in PATROL sense (e.g. “LOGMON”)
· <AdditionalInfo> is an arbitrary name for the additional info you want to capture
· /some/pconfig/var/%instance%/Info is a pconfig variable whose value contains the additional information you want to capture. At runtime, the “%instance%” string will be substituted with the instance SID
· /some/pconfig/var/%instance%/anotherlevel/*/Info2 follows the same principle as above. But here, the “*” is substituted with any value found. This is useful in the case multiple “sub items” can be associated with the monitored instance.
Example :
[LOGMON]
FileName=/PMG_TEXT/Settings/%instance%/Name
SearchString*=/PMG_TEXT/Settings/%instance%/Patterns/*/String1
Custom dimensions from Impact published CIs
It is possible to add your own dimensions to the reporting database and use those in the Self-Service Monitoring Portal reports.
These dimensions are set at “device” level – that is, you can associate external information (customer name, location, cost center, etc) for each device discovered by ProactivePack.
In order to do that :
Declare the dimension in the configuration
1. If it is the first customization you apply to the xml file, copy it from $PRODUCT_HOME/config/SelfServiceMonitoringPortalDeviceTranslation.xml to $PRODUCT_HOME/config/custom/SelfServiceMonitoringPortalDeviceTranslation.xml
2. Open $PRODUCT_HOME/config/custom/SelfServiceMonitoringPortalDeviceTranslation.xml
3. Declare dimension in file
a. The xml tag must be unique and will be the displayed label in ProactivePack
b. SlotType must be STRING
c. DBTable must be “AdditionnalInfos”
d. DBColumn must be “InfoValue”
For example :
<CostCenter version="1.0" SlotType="STRING" DBTable="AdditionnalInfos" DBColumn="InfoValue"></CostCenter>
4. In TrueSight / Defaults improve source as below example:
<Customer Source="Cell" SourceField="BMC_ComputerSystem:UsingOrganization" CompareCondition="mc_udid==ExternalRefId"></Customer>
5. Save file
Declare the import mechanism from TrueSight based CIs
You must then declare how the DB will be populated with information from TrueSight Cell where Cis are published.
Thoses properties must be set and best check:
· Source=”Cell” (cell name defined in configuration as ServiceModelCells
· SourceField="BMC_ComputerSystem:UsingOrganization"
· CompareCondition="mc_udid==ExternalRefId"
Properties syntax and usage:
· Source: Currently only Cell supported
· SourceField: <CI Class>:<CI Slot to map>
· CompareCondition: CI propertie to Check versus Device properties. By defaut mc_udid==ExternalRefId must manage expectations
So, for device vm-rh7-cust2-01 and CI defined as:

In ProactivePack ‘Customer’ dimension, value will be set to ‘Customer Demo 2 defined in CMDB’