Creating Quick Queries
Common parameters
The graph type is chosen from the main selector :
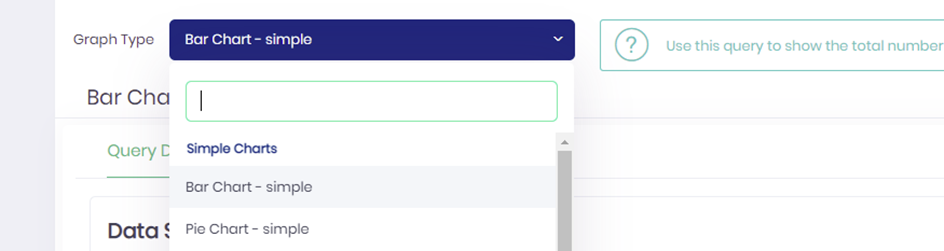
All types of quick queries share a series of same configuration options:
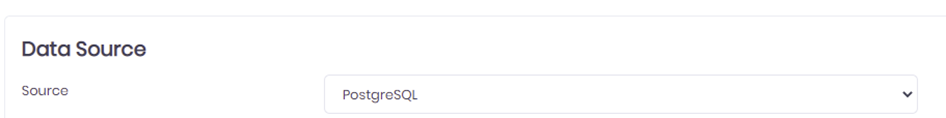
- The target data source, which can be a cell or the database :
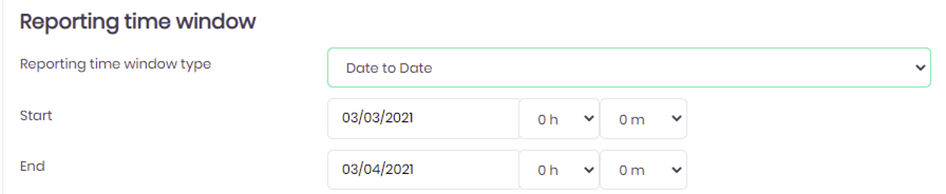
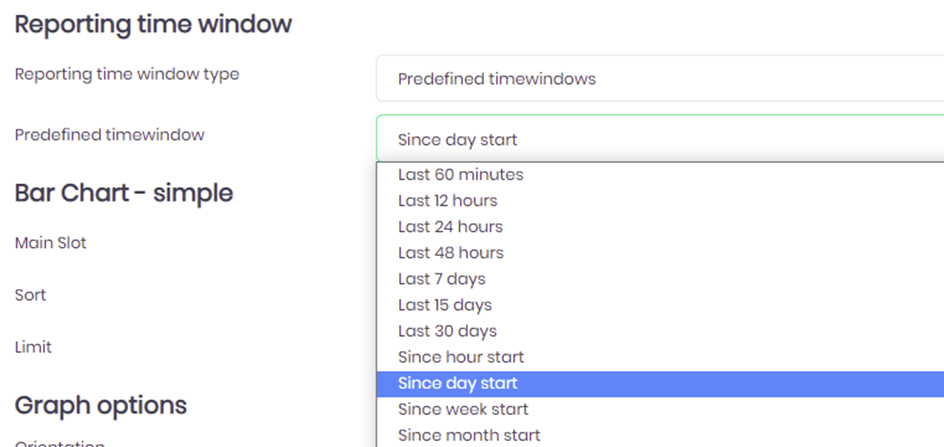
- The Quick Queries time window, which can be defined in 3 ways :
- From date to date, by specifying a start and end date/time:
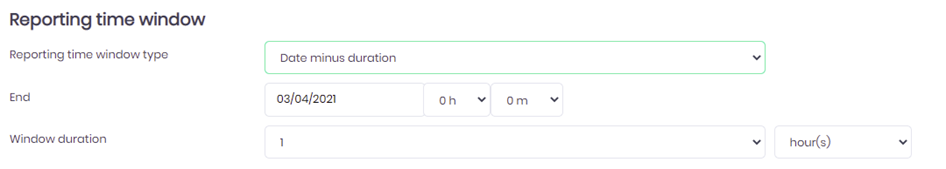
- On an interval, i.e. using an end date minus a set period. For example “May 20, 2014 minus 10 days” will mean “from May 10 until May 20”:
- Using predefined time windows. In that case the time window is automatically set and will adjust from one execution to the other. E.G. if you select “since the beginning of the month”, the time window will be updated every time the query is run.
Additional slot conditions
All quick queries can use additional slot conditions to filter the events that must be part of the report. You can set additional conditions by selecting the “Advanced Conditions” tab :
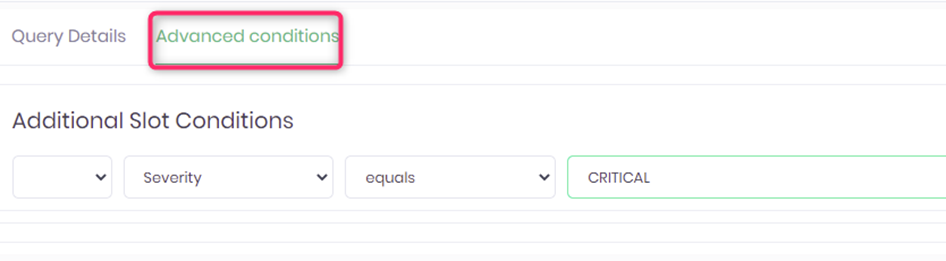
The ProactivePack interface will provide input assistance when building advanced conditions.
This means that e.g. selecting an enumerated field such as severity will cause the valid enumeration values to show in a dropdown list.
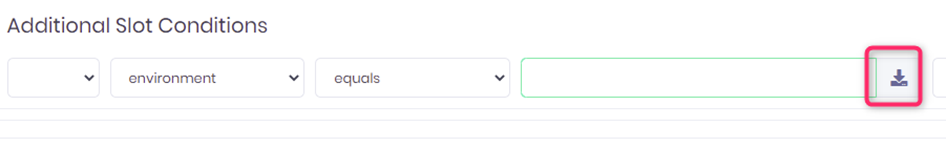
For string parameters, input assistance is provided by clicking on the “download” button. The list of known values is loaded in the form and auto-completion can then be used.
i Please note the following :
Test against string/enumeration values are case sensitive when targeting a cell, and case insensitive when querying the SQL DB.
To test against empty strings, you can leave the text box empty or use two double (“”) or single (‘’) quotes. In this case, only the “equals” and “not_equals” operators can be used.
Tests against “LIST_OF” slots will automatically provide a selection box to provide allowed values. To manually enter values, click on the “I” icon to get to a plain text box.

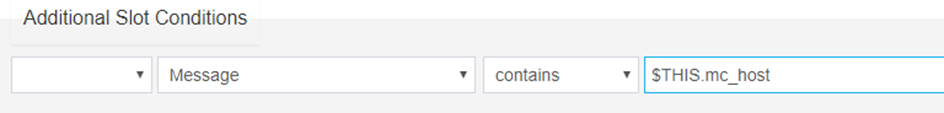
1. STRING and LIST_OF STRING slots can be compared against each other. For example, to test if the msg field of an event contains the mc_host value of the same event, you can define :
External sources
It is possible to define the list of possible “autocomplete” values for a given slot in the advanced conditions dialog.
To do that :
1. In the [ExternalSources] section of the $PRODUCT_HOME/config/custom/QuickQueries.conf module, add a line of the format :
a. For script of file based source:<slotname>=cmd|file:<filename>
b. For DDA source based:<slotname>=dda:Cell:Table:Slot will query slot on configured cell/table
c. For EVENT source based:<slotname>=evt:Cell:EventClass:Slot will query slot on configured cell/event class.
E.G.
mc_host=cmd:./Tools/bin/GetListOfHosts.sh
Five arguments are passed to the script:
· First argument : CellName
· Second argument: “QuickQueries”
· Third argument : SlotName
· The user name
· The user group name
2. When accessing the slot from the Advanced Conditoins dialog, the following icon will indicate that a list of values is available through this mechanism.

Specific parameters
Depending on the graph you choose to build, specific parameters will be presented to you, as per the following table.
|
Graph type |
Parameters |
|
Simple pie |
Main Slot: the name of the slot whose values will be displayed in the pie. Sort: Specifies whether the pie parts are displayed alphabetically or starting with the largest one. |
|
Ratio pie |
Ratio Condition: the condition (slot / operator / value) that must be met by events to be “within” the ratio. |
|
Simple line |
Step Size: the sampling interval – i.e. the time between two points in the graph. Growth interpretation: Indicates how a growth in the plotted value (e.g. between the beginning and the end of the timewindow) should be interpreted business-wise. “Positive” will mean that the trends indicator of the graph will be green if the growth is positive, and red otherwise. “Negative” will be the other way around. “Neutral” will leave the indicators in blue in the graph. |
|
Composite line |
Step Size: (see above) Group By slot: a line will be drawn for each value of that slot. |
|
Average line |
Step Size : (see above) Numeric Value: The numeric value that is averaged for the graph. The list of numeric values is provided by the CustomIntervals parameter, see the QuickQueries.conf reference section below. Please note that only events whose numeric value is strictly positive are considered for building the graph. Growth interpretation : (see above) |
|
Composite average line |
Step Size: (see above) Group By slot: (see above) Numeric Value: (see above) |
|
Simple bar chart |
Main Slot: The slot whose values are used to build the bar chart, i.e. one colon (or bar) per value of that slot. Sort by: Specifies if the colons (or bars) are sorted alphabetically or by value. Limit: Can be used to specify a filter, i.e. a “top N” or “bottom N” so that not all values of “Main Slot” are presented. Please note that the limit is computed after the “Sort By”. Orientation : Show colons or bars. |
|
Composite bar chart |
Main Slot: (see above) Group By Slo : provides a secondary grouping total. Sort by: (see above) Limit: (see above) Orientation : (see above) Stacking : Use one colon (or bar) by “Group By” slot value or use a single colon (or bar) for each Main Slot value |
|
Average values bar chart |
Main Slot : (see above) Numeric : The numeric value that is averaged for each column of the graph. Sort by : (see above) Limit : (see above) Orientation : (see above) |
|
Ratio bar chart |
Main Slot : (see above) Ratio Condition: The condition that divides events between “within” and “outside” ratio. Sort by : (see above) Limit : (see above) Orientation : (see above) Scale : Determines whether the bar shows the total number of events, or represents 100%
|
|
Ratio diagram |
Step Size : (see above) Ratio Condition : (see above) Scale : (see above) Growth interpretation : (see above) |
|
Heatmap |
Main Slot : the slot whose values are used for the vertical axis of the heatmap Group By Slot : the slot whose values are used for the horizontal axis of the heatmap Weighting : Determines how the color of each cell of the heatmap is used : - Number of events : the number of events determines the color. Few events is on the green side, many events is on the red side of the scale. - Number of events times severity : For each cell of the heatmap, the value (and therefore the shade on the color scale) is based on the number of events multiplied by their severity value (using the BAROC enumeration definitions, e.g. CRITICAL = 80 and WARNING = 40). For example, a cell “containing” 3 CRITICAL events and 2 WARNING events will have a value of 3 * 80 + 2 * 40 = 320. - Maximum severity. The color of the cell is set by the maximum severity of the contained events. Severity if no event : Is used only if the weighting is “Maximum Severity” and determines the color of a cell where no events are present. |
|
Table report |
Column set : used to specify the Column set that will be used for that report. |
|
Simple gauge |
Maximum value for gauge: an arbitrary, numeric value that defines the “maximum” value for the gauge. The maximum value is adjusted if the query returns a number that is higher than the set maximum. |
|
Ratio gauge |
Ratio Condition : (see above) |
|
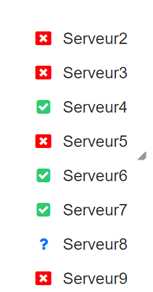
Weather chart |
Main Slot : The slot whose values are used to build the weather chart, i.e. one icon per value of that slot Grouping : Three values are possible : - None : Only one table is displayed, containing one icon for each value of <Main Slot> - By slot : One table is built for each of the value of <Grouping Slot>. - Using Reference Data : the tables are build according to the output of a script or a file, see below. Grouping slot: This parameter is considered only if the “By slot” option is selected above. All combinations of “Main” and “Grouping” slots are charted in the map. Reference data : This parameter is considered only if the “Using Reference data” is selected above. Reference data can be a file, or a script that contains (or generates) entries of the format : <grouping value>,<Main slot value>,<status> One table is built per value of <grouping value>. Each table contains one entry per <main slot value>. <status> can be either “online”, “offline”; or “maintenance”. If online, event numbers are used to determine the icon, else the offline or maintenance icon is displayed. The format of the Grouping Slot value is : cmd|file:<path to file> In case a script (cmd:) is used, the following values are passed as arguments : <CellName> <SlotName> <UserGroup>
Reference data field separator : This parameter is considered only if the “Using Reference data” is selected. Allows to specify a different field separator in the script or file provided in the “Reference data” parameter. Animation: Indicates if the display will be based on the number of events, or on the maximum severity. Rain threshold : This parameter is considered only if the “Animation” parameter is set to “by number of events”. The number of events (per value of <Main Slot>) that are needed to show a “rain” icon. Disabled if set to 0. Cloud threshold : This parameter is considered only if the “Animation” parameter is set to “by number of events”. The number of events (per value of <Main Slot>) that are needed to show a “cloud” icon. Disabled if set to 0. Sun/Cloud/Rain/Offline/Maintenance icon : The name of the file for the “sun”. The file must be located under $PRODUCT_HOME/images. |
Viewing Results
Once executed, the quick query result will automatically show in the console.
From there, several options are available:
- Most graph parts are also “clickable”, meaning that clicking on any part of the chart (a bar, a pie part, a dot on a line, etc) will open a table view on the events “beneath” the clicked object.
- Below the chart, 3 buttons let you :
o Export the graph data as Microsoft Excel spreadsheets or as .csv files
o View the table query for the events underlying the current graph
o Save the query that generated the current graph, see below.
Saving requests
From the Query Editor, or after the query itself has been run, the request can be saved for later use by using the “save query” button. When a request is saved, all the configuration parameters (date range, target, advanced conditions, etc) are saved for later use.
Saving the request is done from a simple form that shows the following fields:
|
Short Name |
Mandatory. A short name for the request you save (special characters and spaces are not allowed as the short name is used to build a file name). |
|
Description |
Optional. A free text description for the request |
|
Scope |
Determines the scope (visibility) of the quick query. The choices that are available depend on the user permissions. - Private : only the user who creates the query will be able to use it. - Group : Only members of the user’s group will be able to use this query. - Global : All users will be able to use this query. |
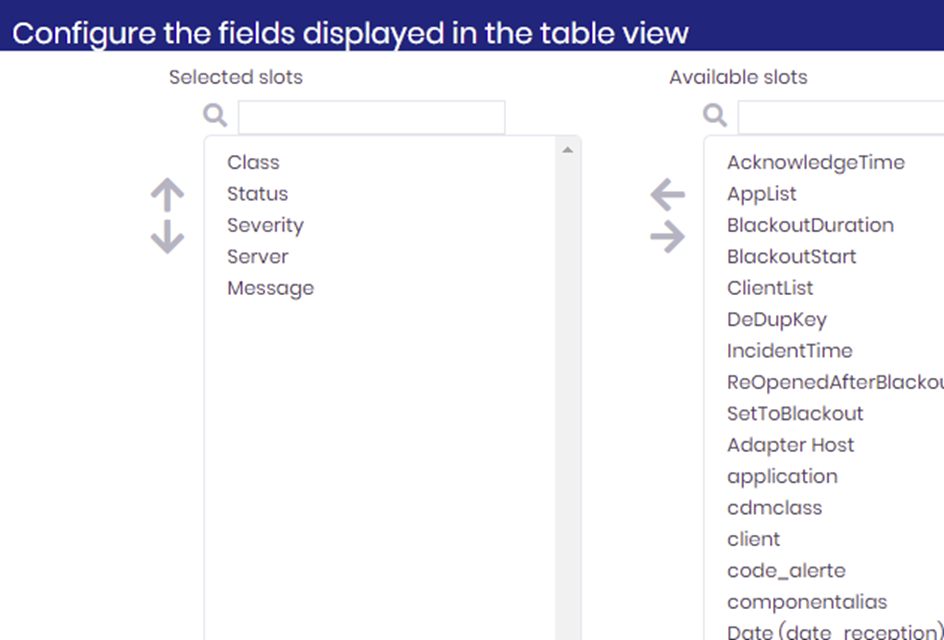
Column sets
The list and order of columns (“Column set”) that are used in the table reports can be configured using the “Table Slots” action of the “QuickQueries” menu.
The action lists the currently available Column sets is displayed, and (subject to permission) you can create and modify new Column sets.
The dialog to edit the columns of the table report is as follows and should be self-explanatory.
The “scope” property works the same as for QuickQueries:
- Private : only the user who creates the Column set will be able to use it.
- Group : Only members of the user’s group will be able to use this Column set.
- Global : All users will be able to use this Column set.
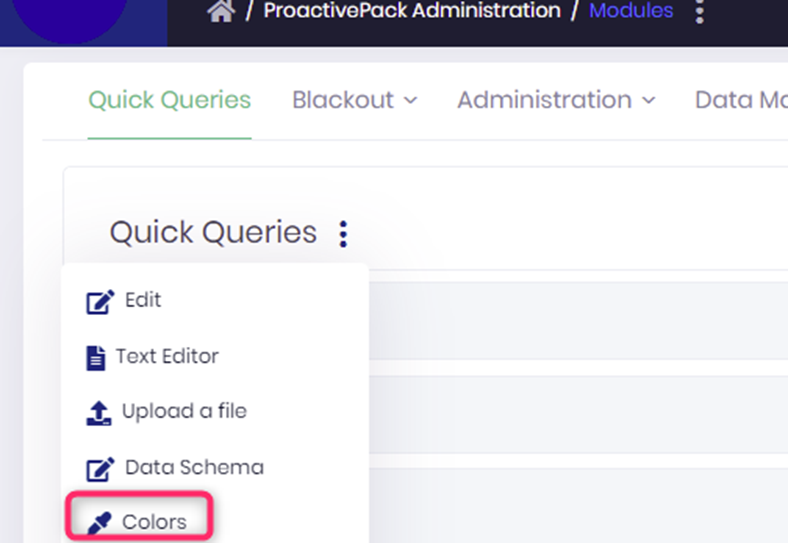
Colors
The color of graph elements can be configured, depending on the value of that graph element. Classical cases include severity and priority, but you can associate a color to any slot value (e.g host, application,…)
To access the editor, go to ProactivePack Admistration -> Modules -> QuickQueries -> Colors
In order to help query quality, dynamic colors are computed if not defined. They are re used over the same user session but can generate a bad quality impact on table views. This impact can be changed using QuickQueries configuration
Weather maps
Using weather maps you can create :
1) A View with aligned objects depending on event slot values
2) A view with resizable, draggable objects using a background image
When using a background object, you can move each object on the map once lock is unlocked. Objects positions are automatically saved.
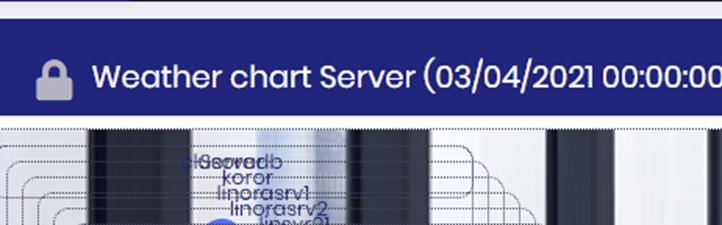
Locking/ unlocking the map
In order to lock/unlock the map, just click on lock as below
Map locked
Map unlocked

Adding an item
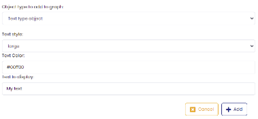
When you click on ‘Add item’ you can select different types of items to add to the view.

|
Type |
Description |
Configuration |
Example |
|
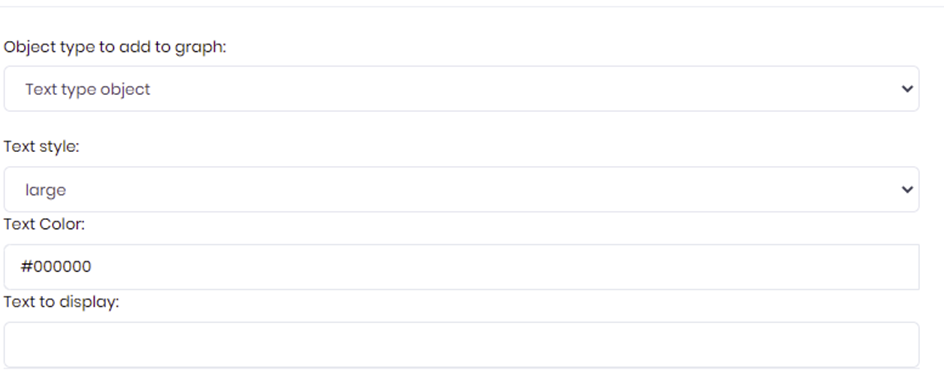
Text type object |
Add a static text over the map |
|
|
|
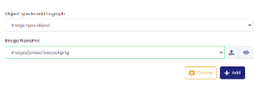
Image type object |
Add an image to map |
|
|
|
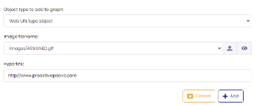
Web URL |
Add a link |
|
|
|
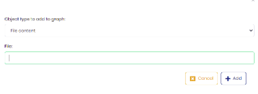
File content |
Read a local file or run a remote http request
Output can be text or HTML |
|
|
|
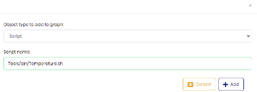
Script |
Run a script on ProactivePack server. The script takes the query name, the user and group as positional arguments. All query parameters as passed to the script as environment variables Output can be text or HTML |
|
|


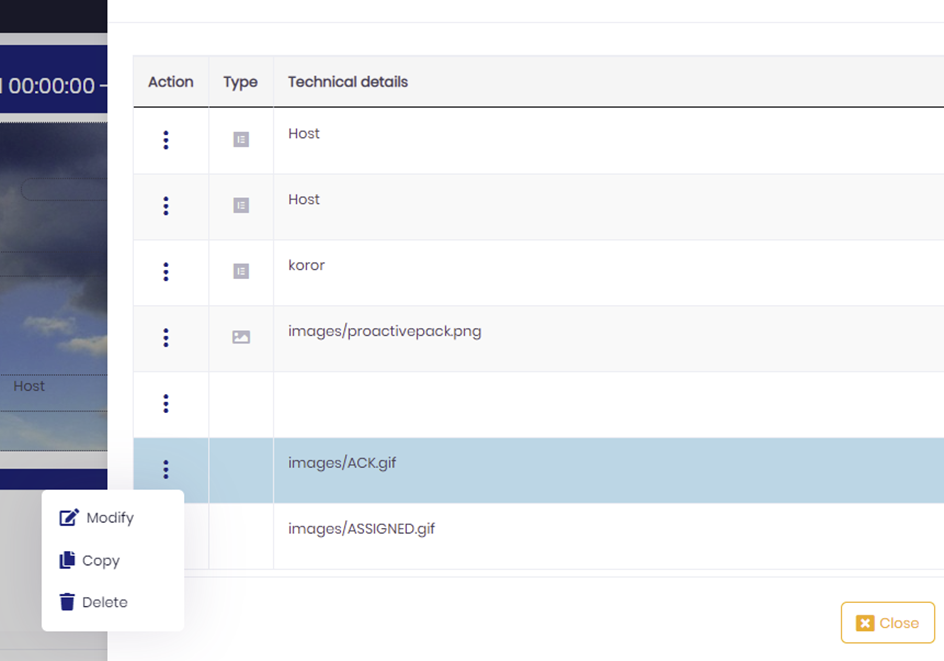
Modifying/Copying/Deleting an item
Access those operations using the context menu in front of each item:

Service model queries
Two specific queries are available to report on the real-time state of service model components stored in a cell.
|
Graph type |
Usage |
|
HeatMap |
Present a heatmap of the current “hotspots” across all top-level business services. The heatmap allows drill-down and visualisation of the corresponding causal/impact events using the “ctrl-click” key/mouse combination |
|
Weather maps |
Present selected Cis in a weather maps (with options similar to the event wheather charts described here) |
i Service Model queries do not work against the database, they work only against cells that contain service model data.
Arguments for the above queries are provided below
|
Graph type |
Parameters |
|
Heatmap |
Selection mode: The “entry” point of the heatmap. Can be : - Highest level business services (i.e. CI of type BMC_BusinessService that have no consumers) - A specific CI, whose class/name is chosen in the corresponding drop-down lists Model Depth: The depth (“number of layers”, from 0 to n) of model that is queried and displayed. Sort tiles by: - Weight : The tiles with the largest number of sub-elements (providers) are shown first - Name : The tiles are (as much as possible) sorted alphabetically Display: Provides different choices for the display algorithm. The choice is essentially dependent on number of objects to display (prefer “squarified” for larger numbers) and user preferences Column set: The column set to use when the event list is displayed. Style Sheet for labels: CSS file that hold the CSS definitions that apply to the heatmap labels. The CSS files are stored under $PRODUCT_HOME/data/QuickQueries/reports/StyleSheets. See below for details
|
|
Weather map |
Column set: The column set to use when the event list is displayed. Background image : Image file presented in the background of the map. |
Heatmap Style sheet
The style (color, size, weight, font type,…) of the labels shown in the heatmap can be modified to match customer preferences.
There is one CSS class corresponding to each level of the heatmap, starting at level 1 (highest) to 7 (lowest) and named TMLevel<level>.
Example :
.TMLevel1 text tspan {
  fill: #ffffff;
  font-weight: bold;
  font-size:14px;
  font-family: Arial;
}
The default definition of these CSS classes is stored in the file :
$PRODUCT_HOME/ /data/QuickQueries/reports/StyleSheets/default_pp_report.css
To modify the classes, copy the above file to another file in the same directory and make edits directly into that file.